California Commute: Getting a firm grasp on L.A.’s bicycling data
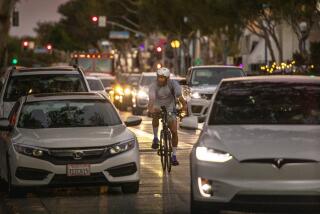
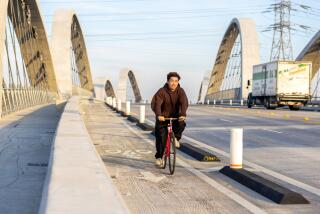
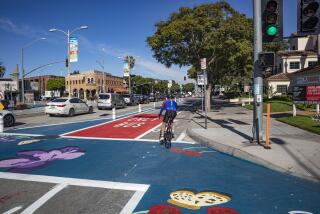
White lines, painted arrows and vivid green paint now separate cyclists from drivers on more than 200 miles of Los Angeles’ vast network of thoroughfares and side streets.
Cyclists have welcomed the recent progress on an ambitious city bike route plan, saying it has provided long-overdue relief from impatient and distracted drivers. Planners say bike lanes calm traffic and make streets safer for everyone — cyclists, pedestrians and those behind the wheel.
At the same time, growing numbers of motorists are complaining that they must endure a squeeze on traffic flow for bike lanes that seem lightly used.
The diverging views highlight a weak spot in L.A.’s planning, several years into a rapid expansion of the bike program: Transportation officials have no comprehensive way to analyze if and how the added lanes have increased cycling, either citywide or in areas where improvements have been made.
Special Report: Hit-and-runs take a rising toll on cyclists
Getting a grasp on that kind of data is costly and complicated, but, cycling advocates say, worth the expense and effort. Good metrics will become more vital as officials, in the face of possible resistance from community groups, are asked to step up investments to fill in gaps and complete the citywide bike plan, which calls for nearly 1,700 miles of new and upgraded paths and lanes before 2035.
“It’s very difficult to convince decision-makers to agree to an investment of any kind if you can’t see the results,” said Eric Bruins, planning and policy director at the Los Angeles County Bicycle Coalition, a nonprofit advocacy organization.
To establish a solid data baseline on L.A. cycling, officials need to buy dozens of automatic bike-counters, which cost thousands of dollars each, or coordinate a citywide count — a tedious, costly exercise requiring hundreds of people to monitor intersections for hours, counting every bike that passes.
Currently, city transportation officials collect information only on cyclists in limited areas for specific projects, such as installing a speed bump or a traffic light. Conducting comprehensive counts over time for planning purposes is a luxury the city hasn’t been able to afford, officials say.
That could begin to change in the next few years. In partnership with the LAPD, the Department of Transportation will start counting cyclists and pedestrians in 2017, if funding is found.
“We’d love to start before then,” Transportation Department spokeswoman Tina Backstrom said. “But it’s a very labor-intensive, budget-intensive thing to do. And L.A. is so large.”
The Bicycle Coalition has conducted its own count of cyclists across the county every other year since 2009. Last year, more than 350 volunteers fanned out to 120 intersections in the morning, afternoon and evening. The counts show a 7.5% increase in cyclists since 2011. But the tally was done “at such a limited scale that I don’t know how many minds we’ve changed,” Bruins said.
Broader, more detailed data collected over several years could clarify which city corridors are used most heavily by cyclists, or where they are opting to use sidewalks. Parsing that information could help officials decide how best to use limited resources for the next phase of lanes.
Gathering additional demographic and behavioral details — gender, age, helmet use — are important clues about how cyclists feel about traveling through certain areas, said David Somers, a bicycle planner in the city’s planning department. “Gender tells us a lot about comfort level,” Somers said. “Women are the canaries in the coal mine. They’re much less likely to ride in uncomfortable situations.”
Santa Monica has added more than 45 miles of bike lanes in recent years and has counted cyclists across the city since 2007. Biking increased 50% during peak periods from 2011 to 2013, the counts showed.
The San Francisco Municipal Transportation Agency has counted bikes since 2006. Last year, it found that cycling had increased by 40% along corridors counted in 2011, and 96% since 2006. The city also bought a $70,000 permanent automatic bike counter that posts data online in real time as cyclists zip down Market Street in downtown San Francisco.
Over time, the technology saves money in salaries, but has its own issues. The device counts only cyclists in the bike lane, and sometimes miscounts when several cyclists ride by together.
Along Broadway in downtown Los Angeles, officials have used video cameras to count pedestrians and cyclists. Videos yield richer data, Somers said, including behavioral observations, but require staff time to analyze and tabulate.
Transportation planners also parse LAPD accident data to identify corridors with the most collisions. The hope is that smart placement of bike lanes can help reduce crashes of all types and assist in reaching an ambitious new city goal of eliminating traffic deaths by 2025.
For now, accident data may serve as a cheap way for bicycle planners to work around spotty cyclist counts. But eventually, city officials will need to figure out how to track bike usage accurately and comprehensively, so they can build out a system that makes cycling a more viable option, advocates say.
The Bicycle Coalition would consider partnering with the city to perform a count, Bruins said, but officials should be willing to spend money, rather than rely on the nonprofit’s current network of volunteers.
“Data matters,” Bruins said. “Officials need to be willing to invest in its collection.”
Special Report: Hit-and-runs take a rising toll on cyclists
Have an idea, gripe or question? Times staff writers Laura J. Nelson and Dan Weikel write California Commute and are looking for leads. Send them along.
For more transportation news, follow @laura_nelson on Twitter.
More to Read
Start your day right
Sign up for Essential California for news, features and recommendations from the L.A. Times and beyond in your inbox six days a week.
You may occasionally receive promotional content from the Los Angeles Times.
