First six months of 2014 were warmest in California’s history
The first six months of 2014 were the hottest ever in California, according to the National Weather Service.
The period was nearly 5 degrees warmer than the 20th century average and more than a degree hotter than the record set in 1934, the National Oceanic and Atmospheric Administration said.
The first half of the year was the second warmest on average in Los Angeles in the last 70 years, with an average temperature just above 63 degrees.
Northern California cities, including San Francisco and Sacramento, experienced the warmest six months ever, NOAA reported.
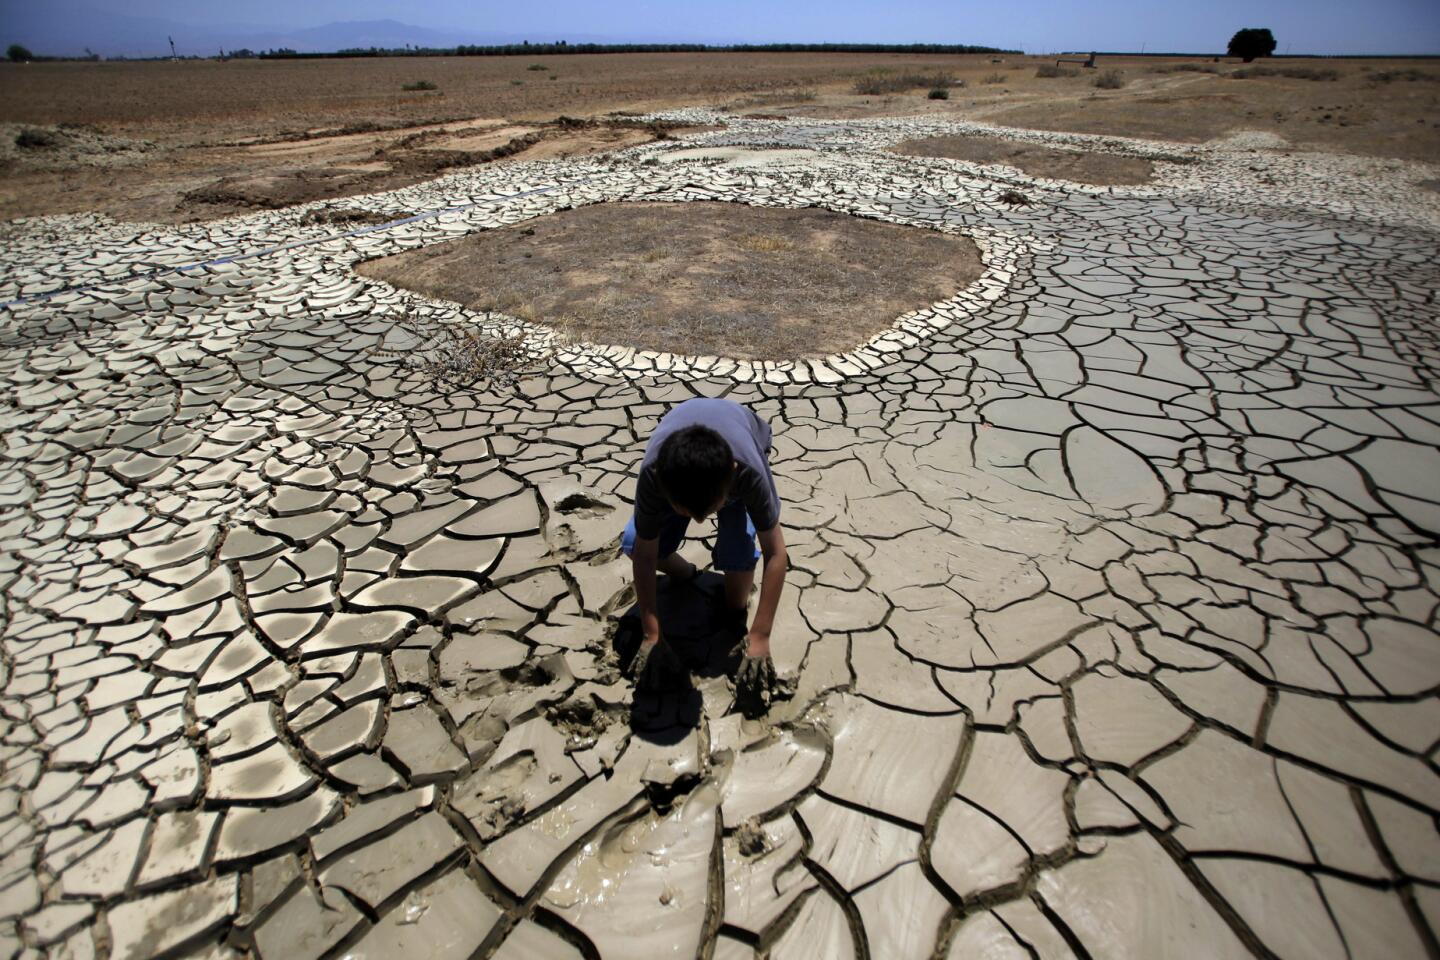
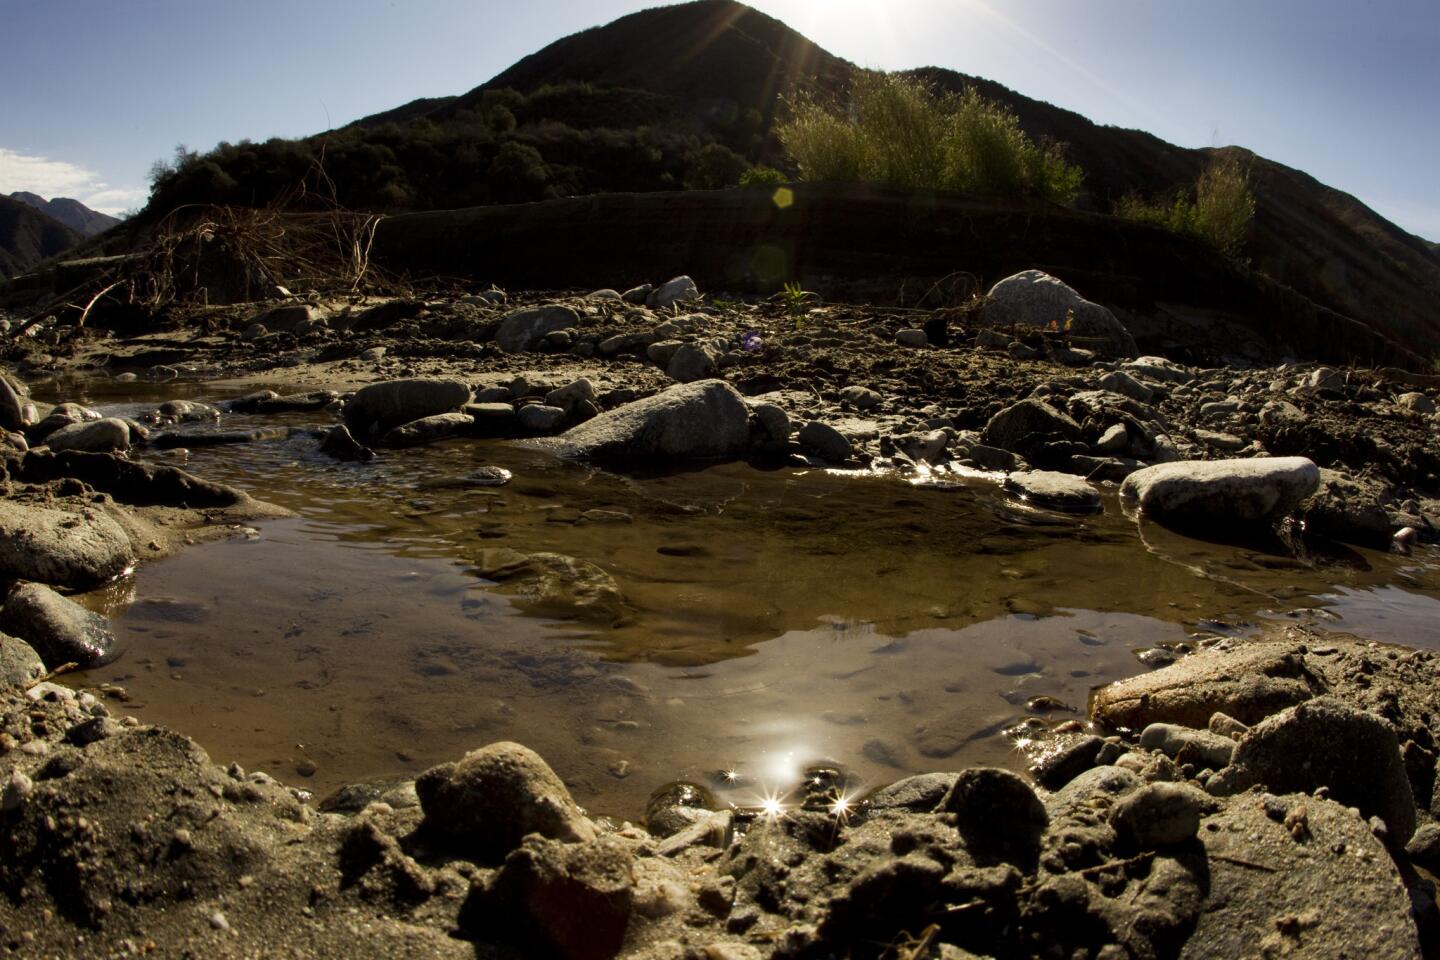
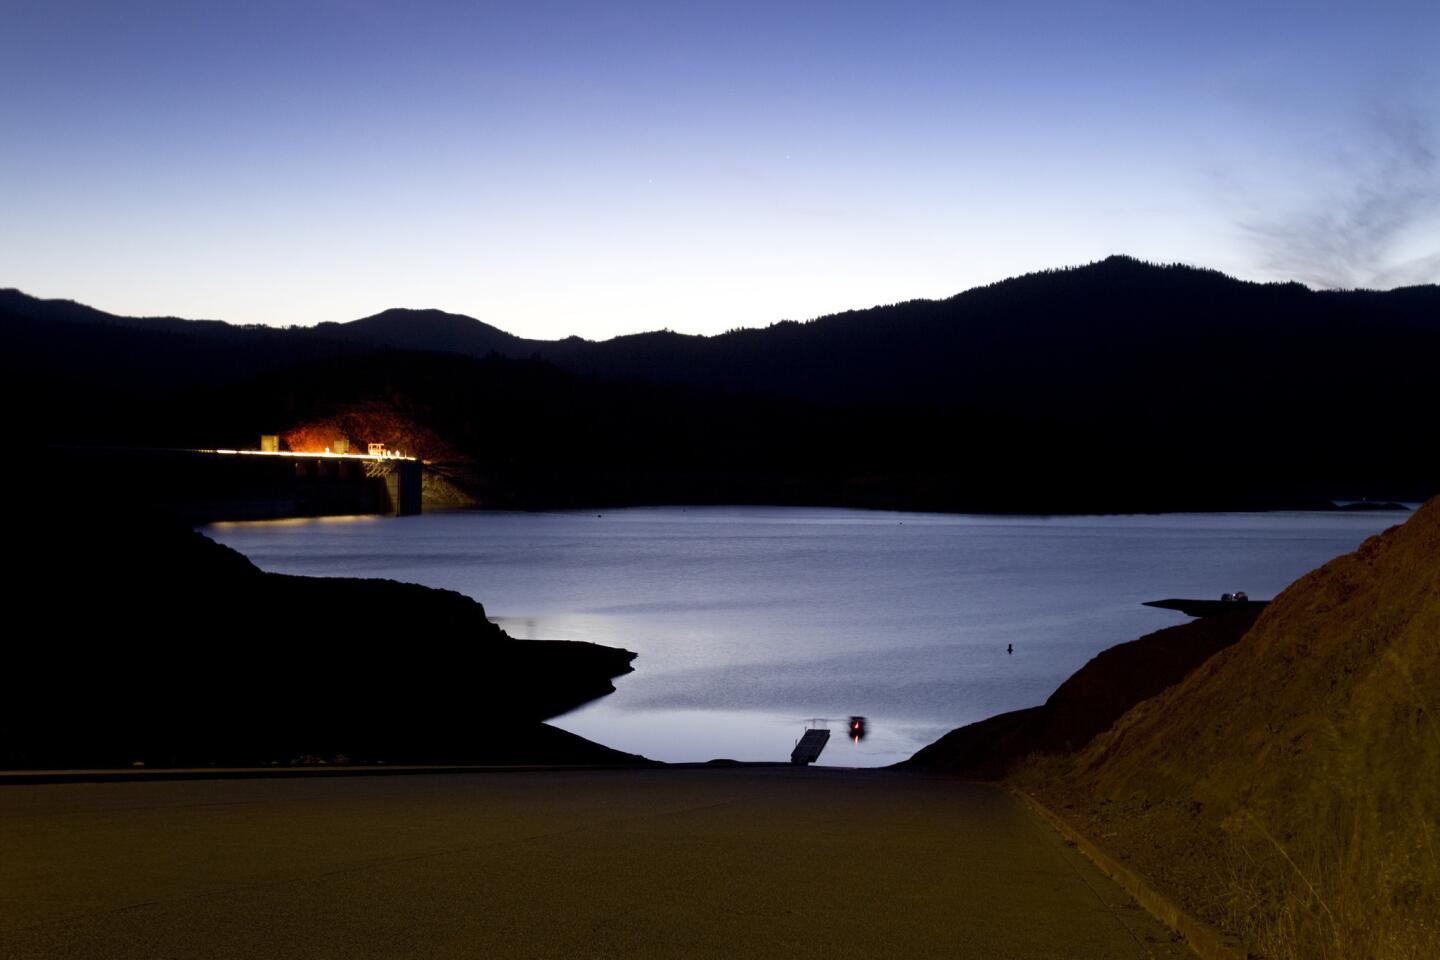
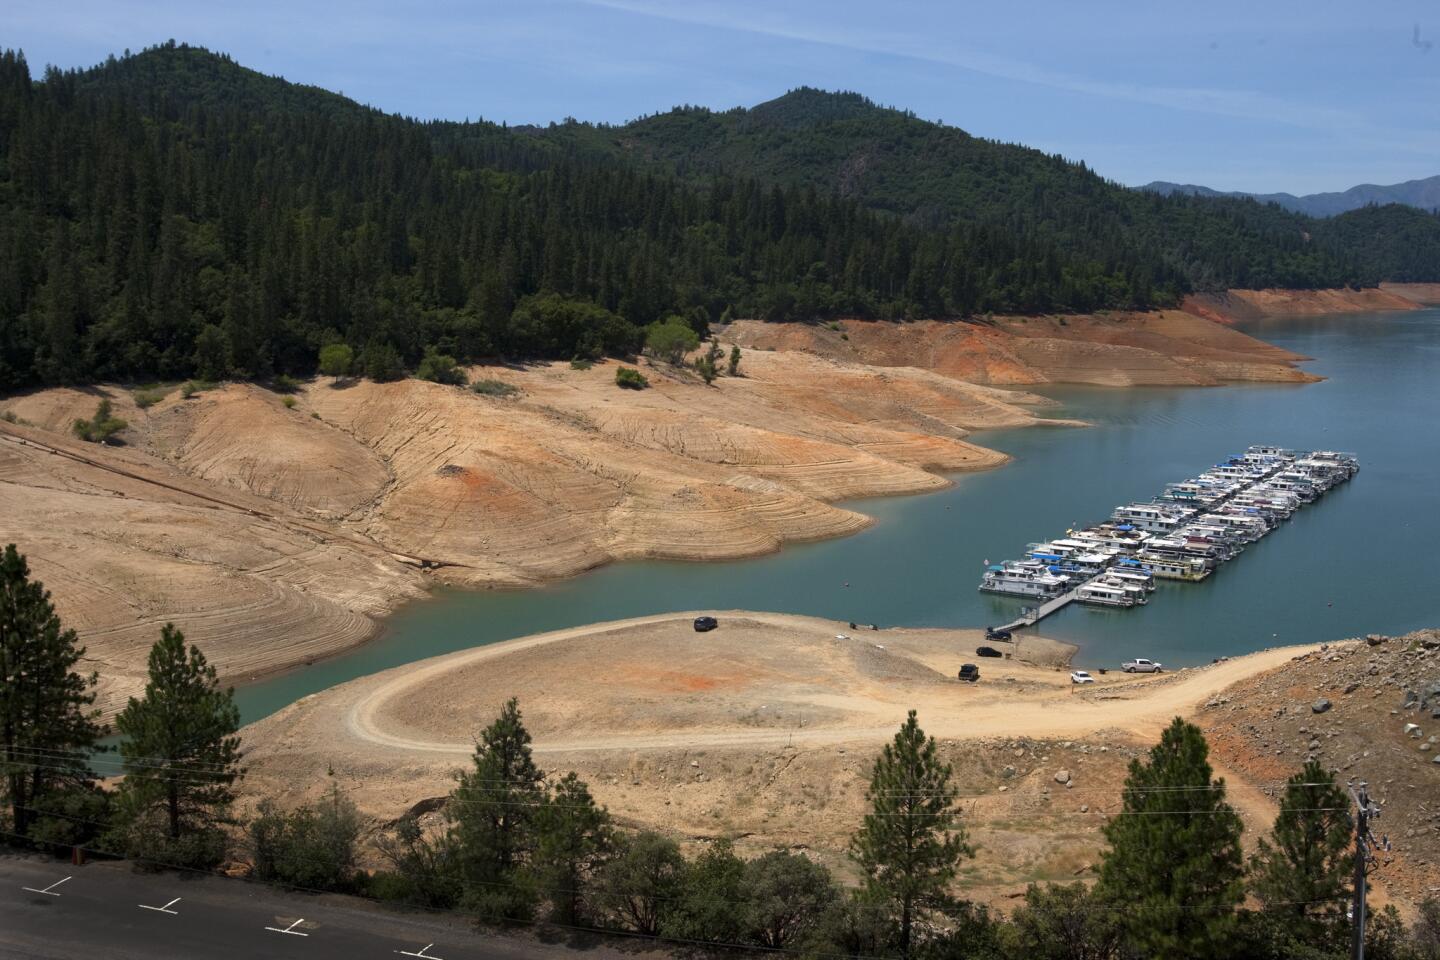
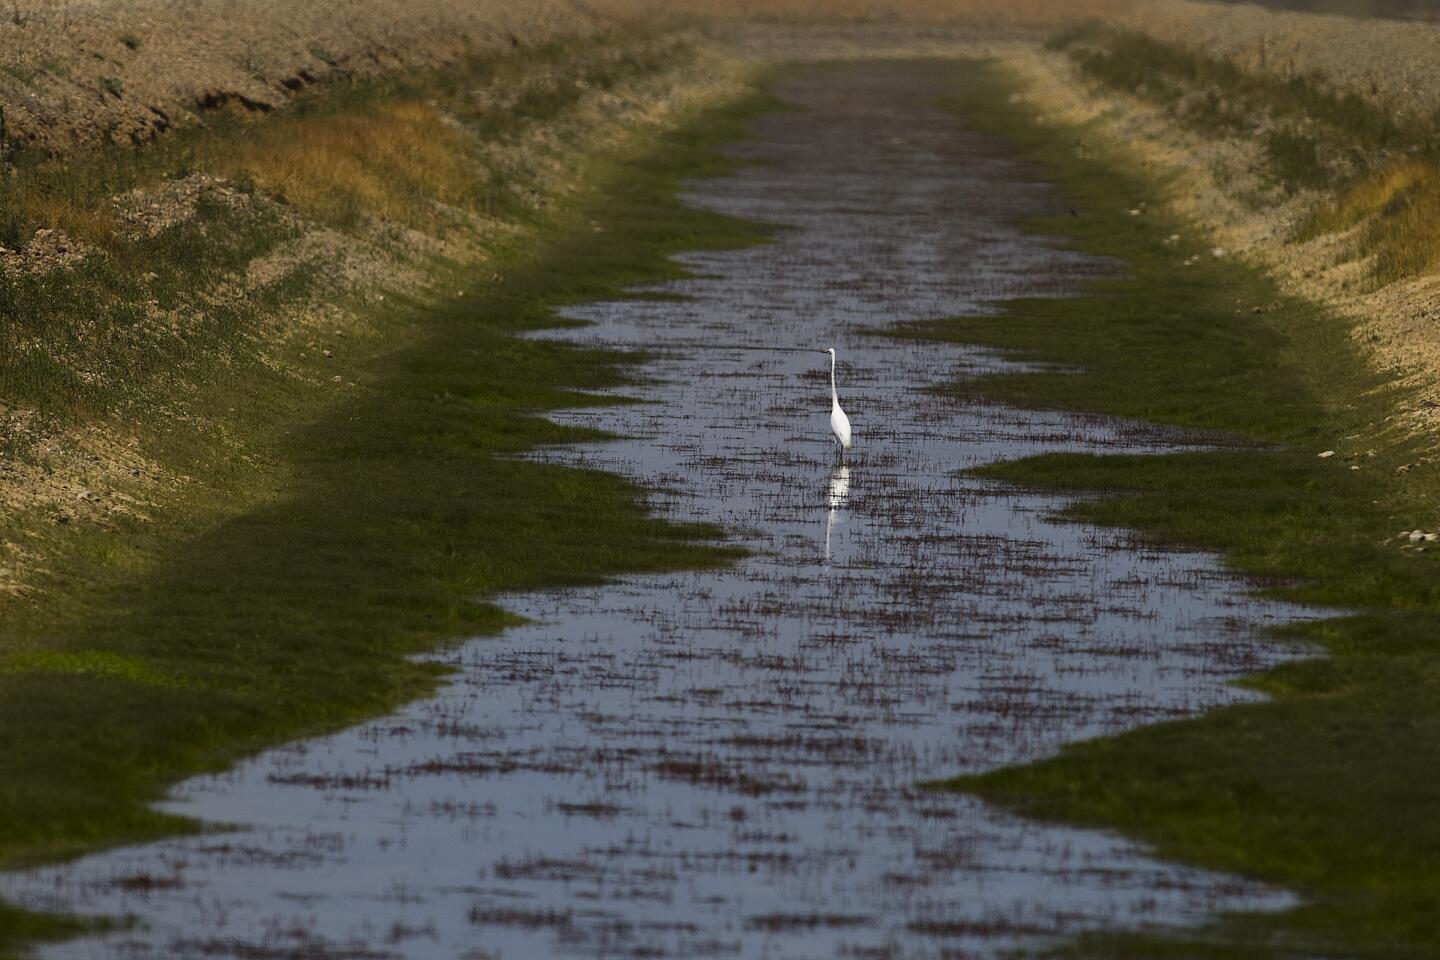
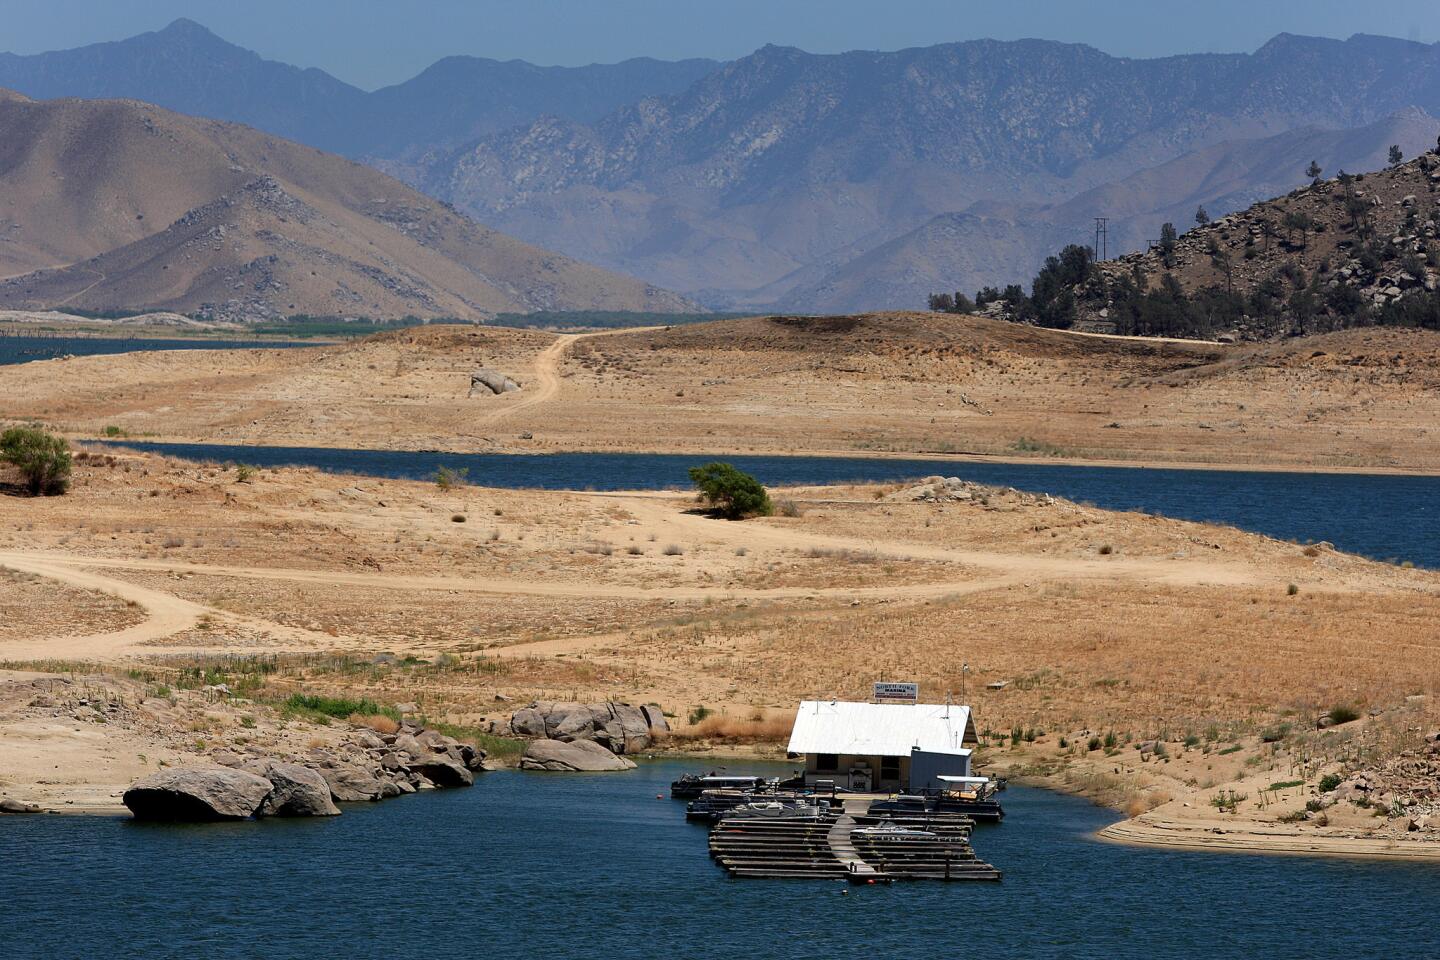
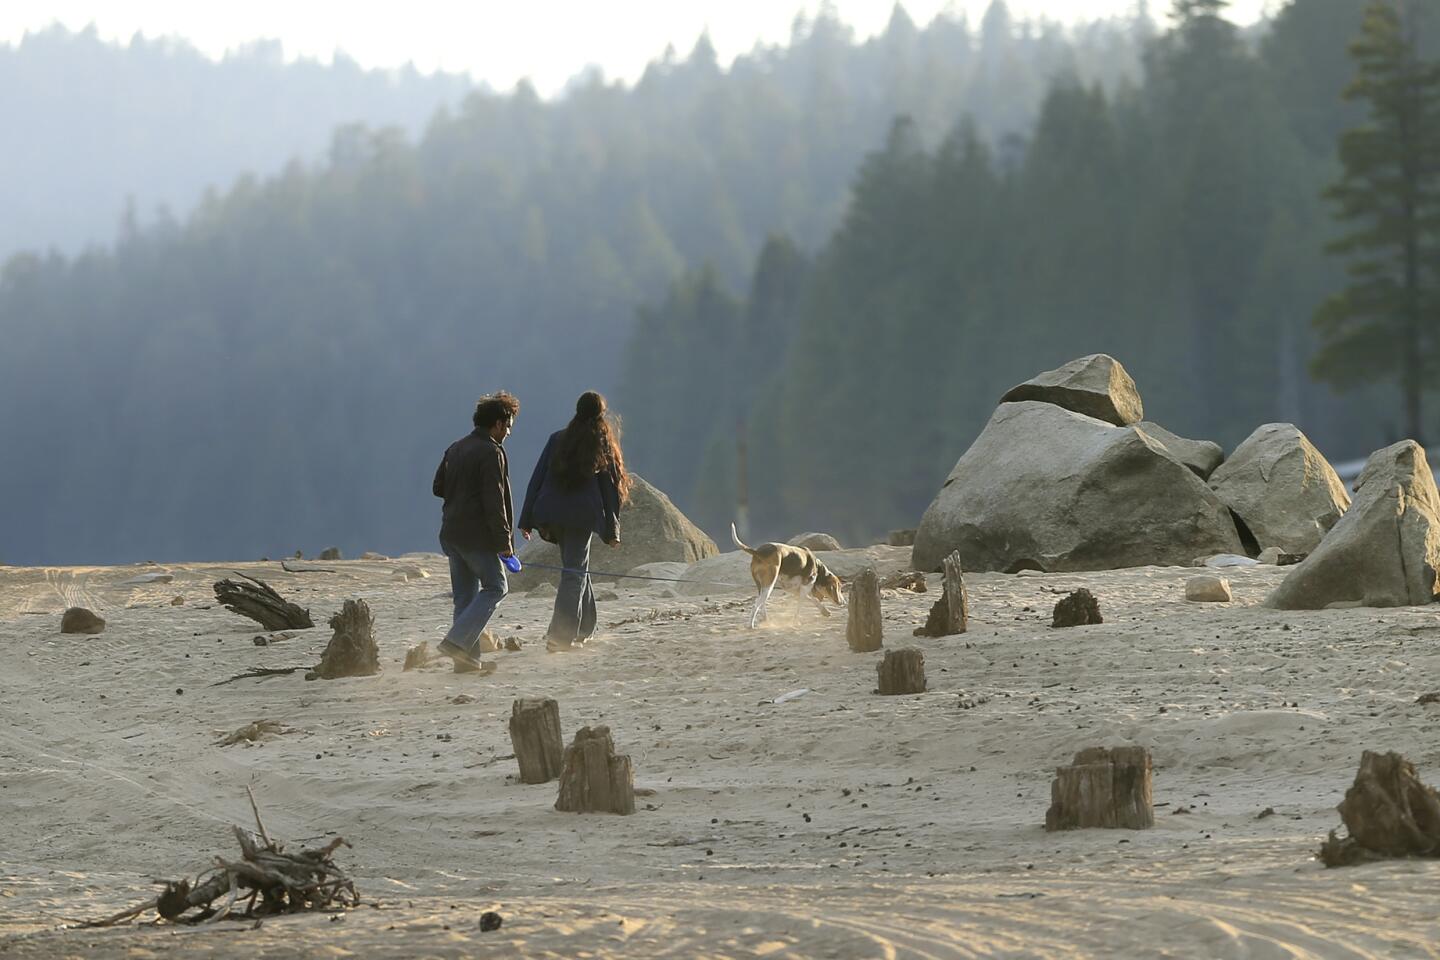
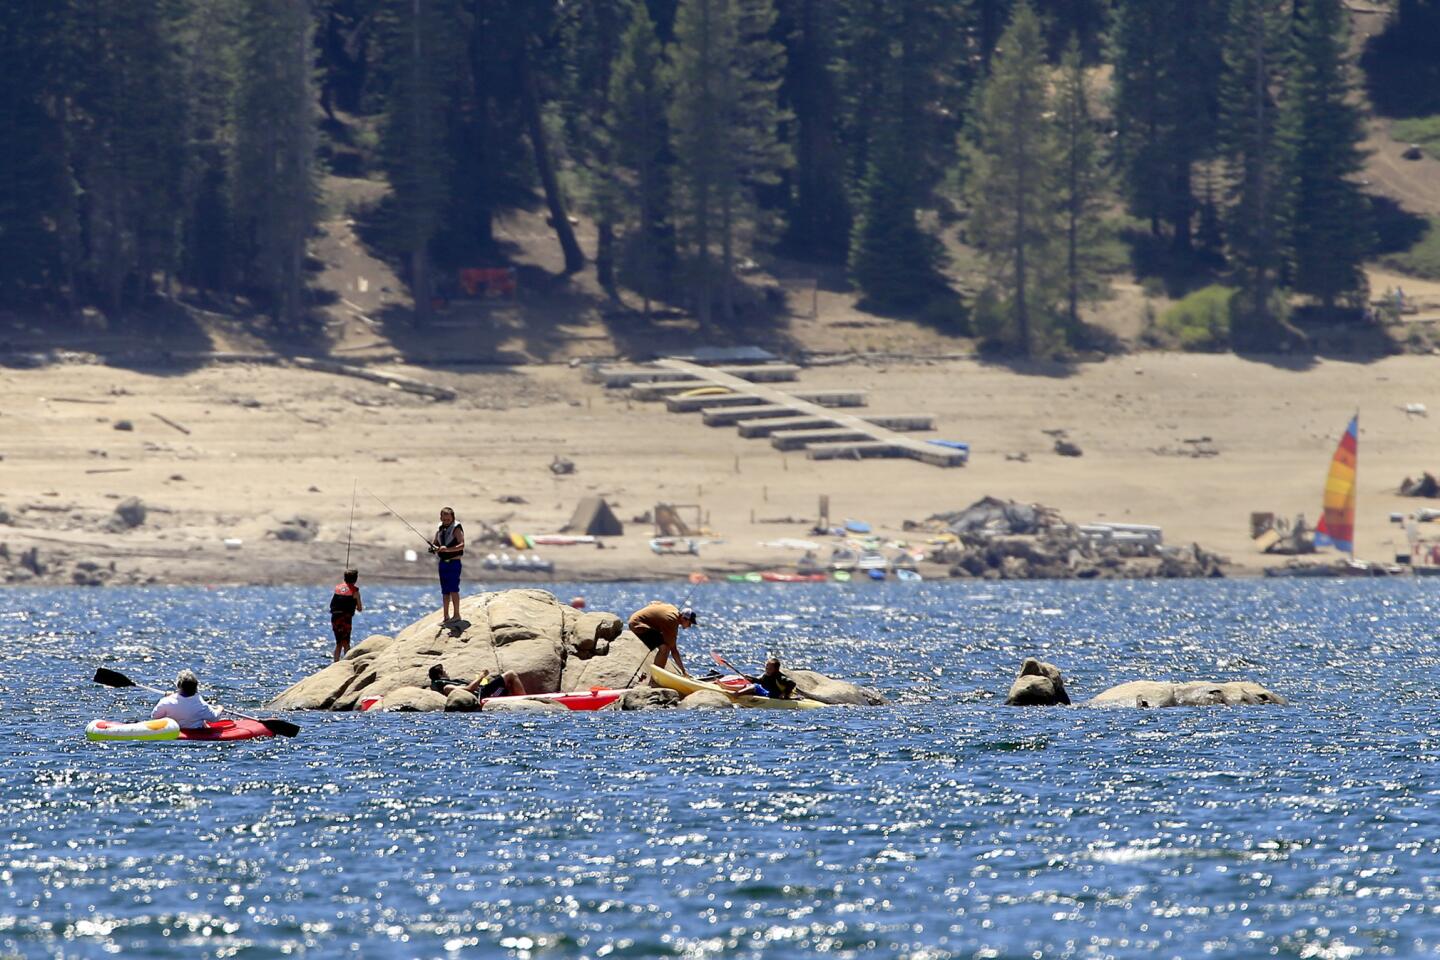
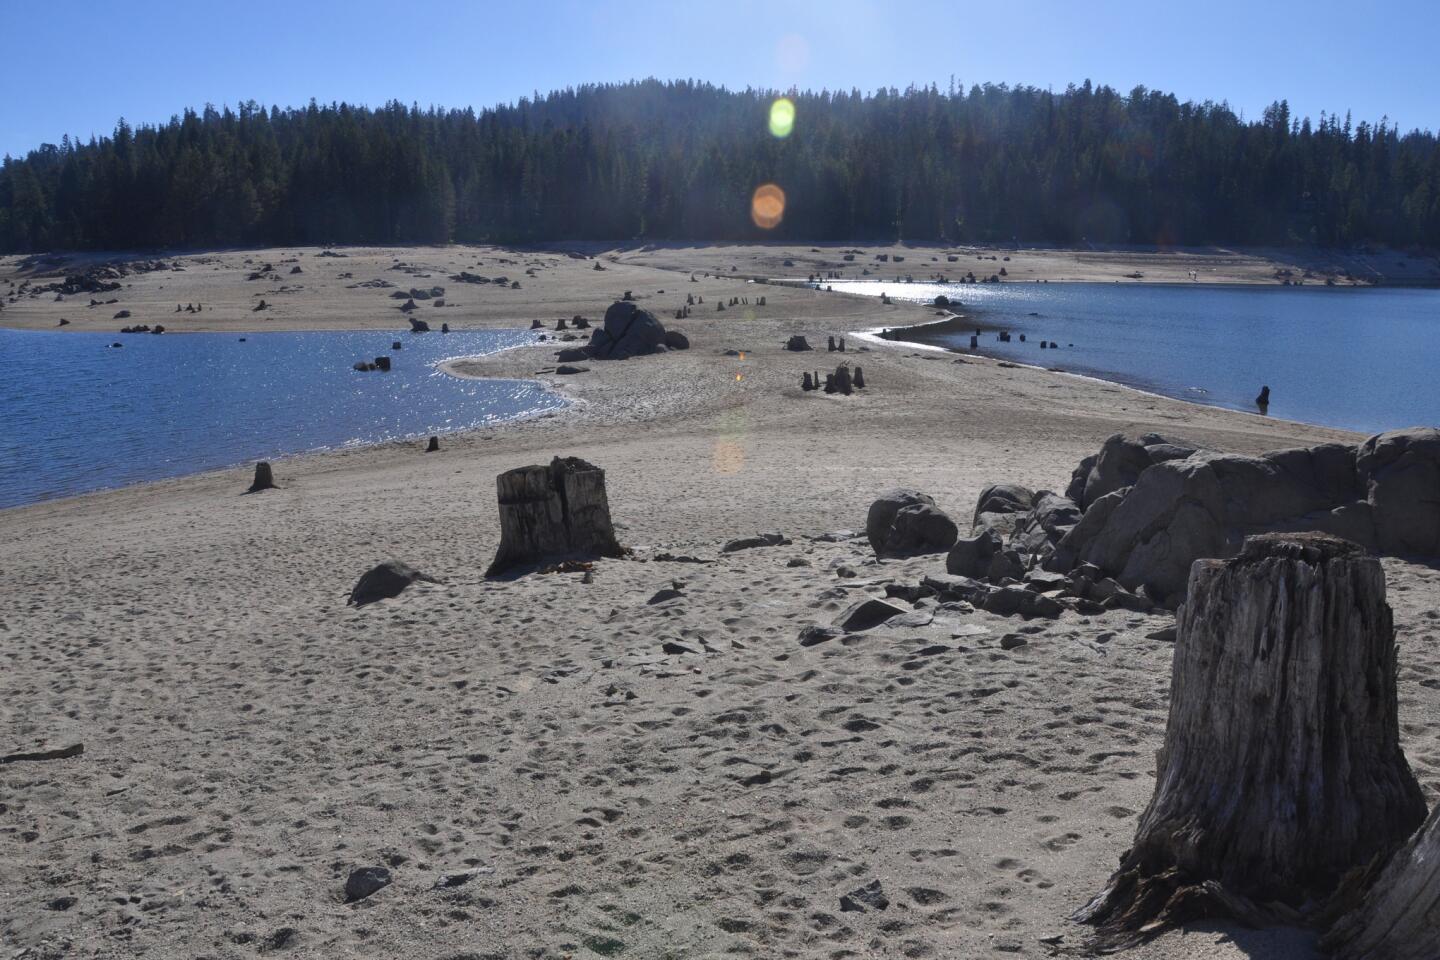
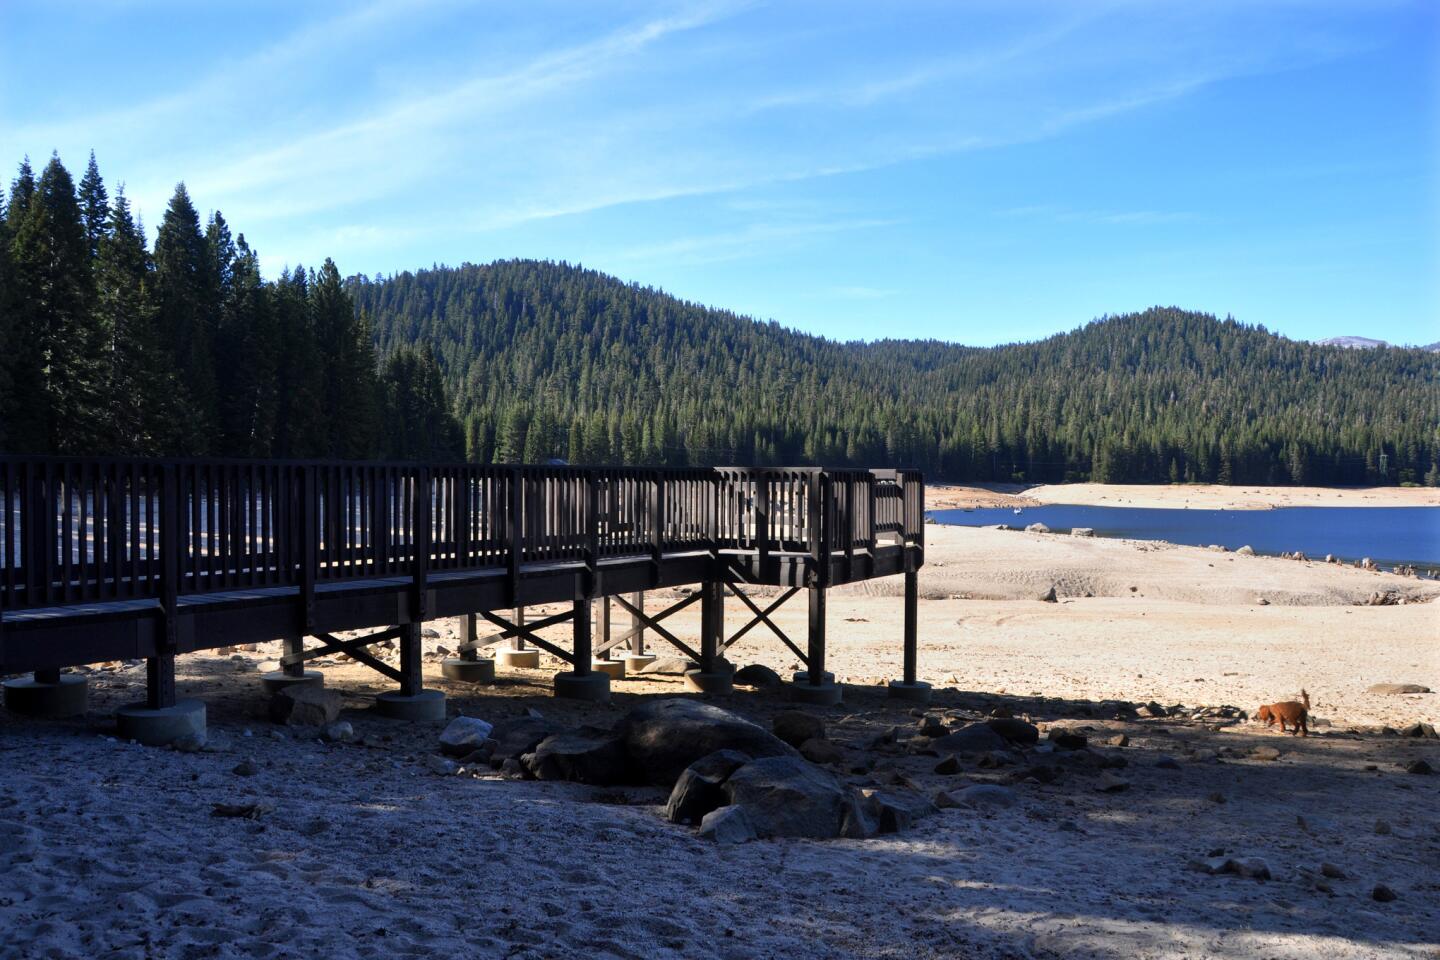
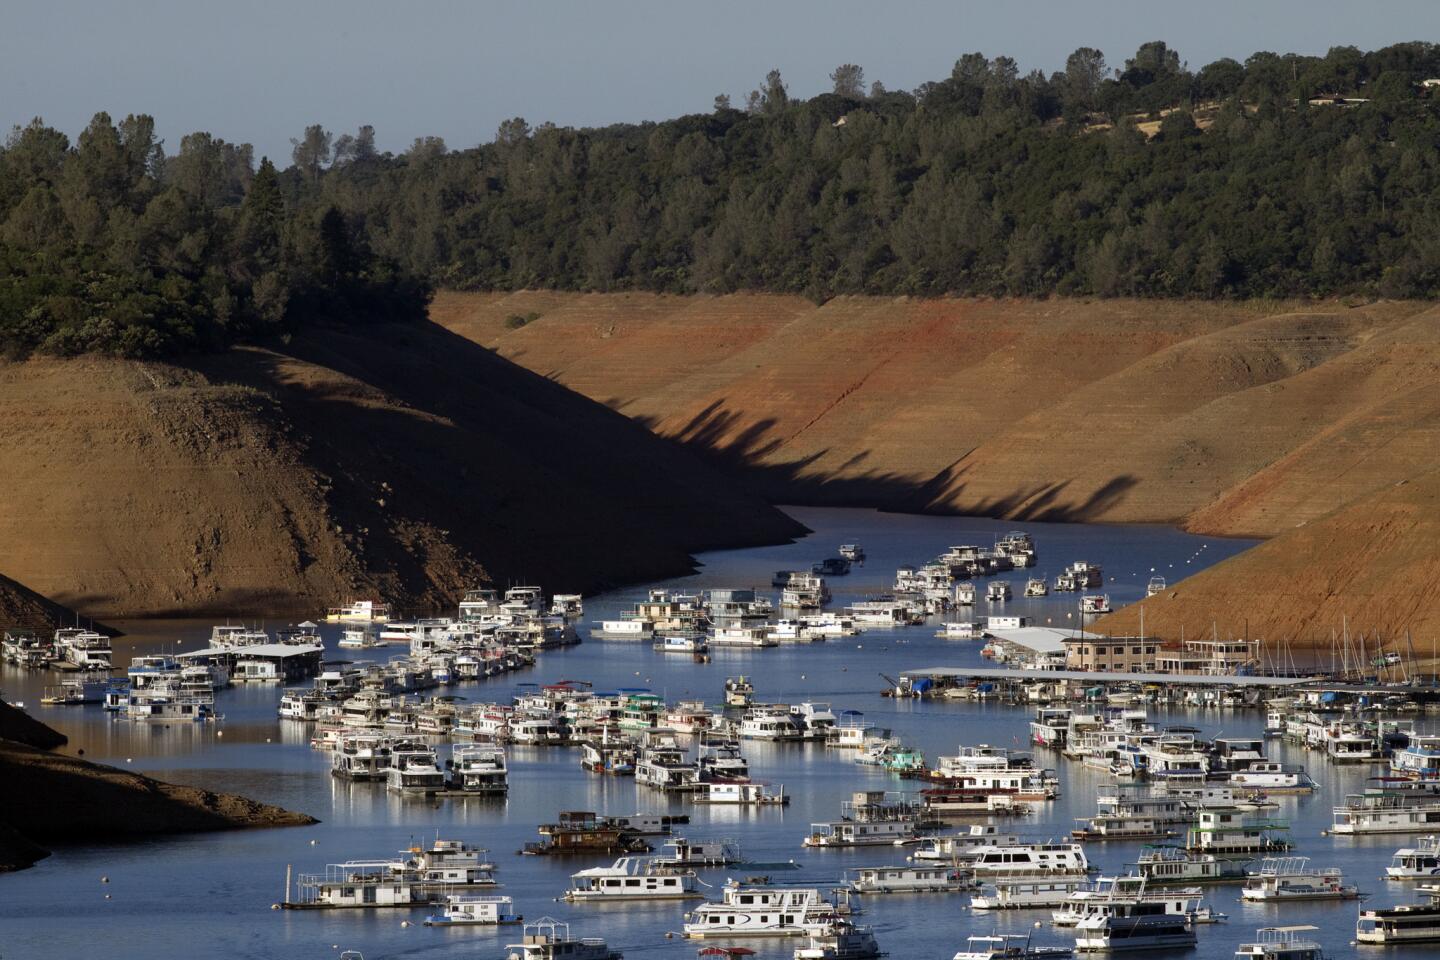
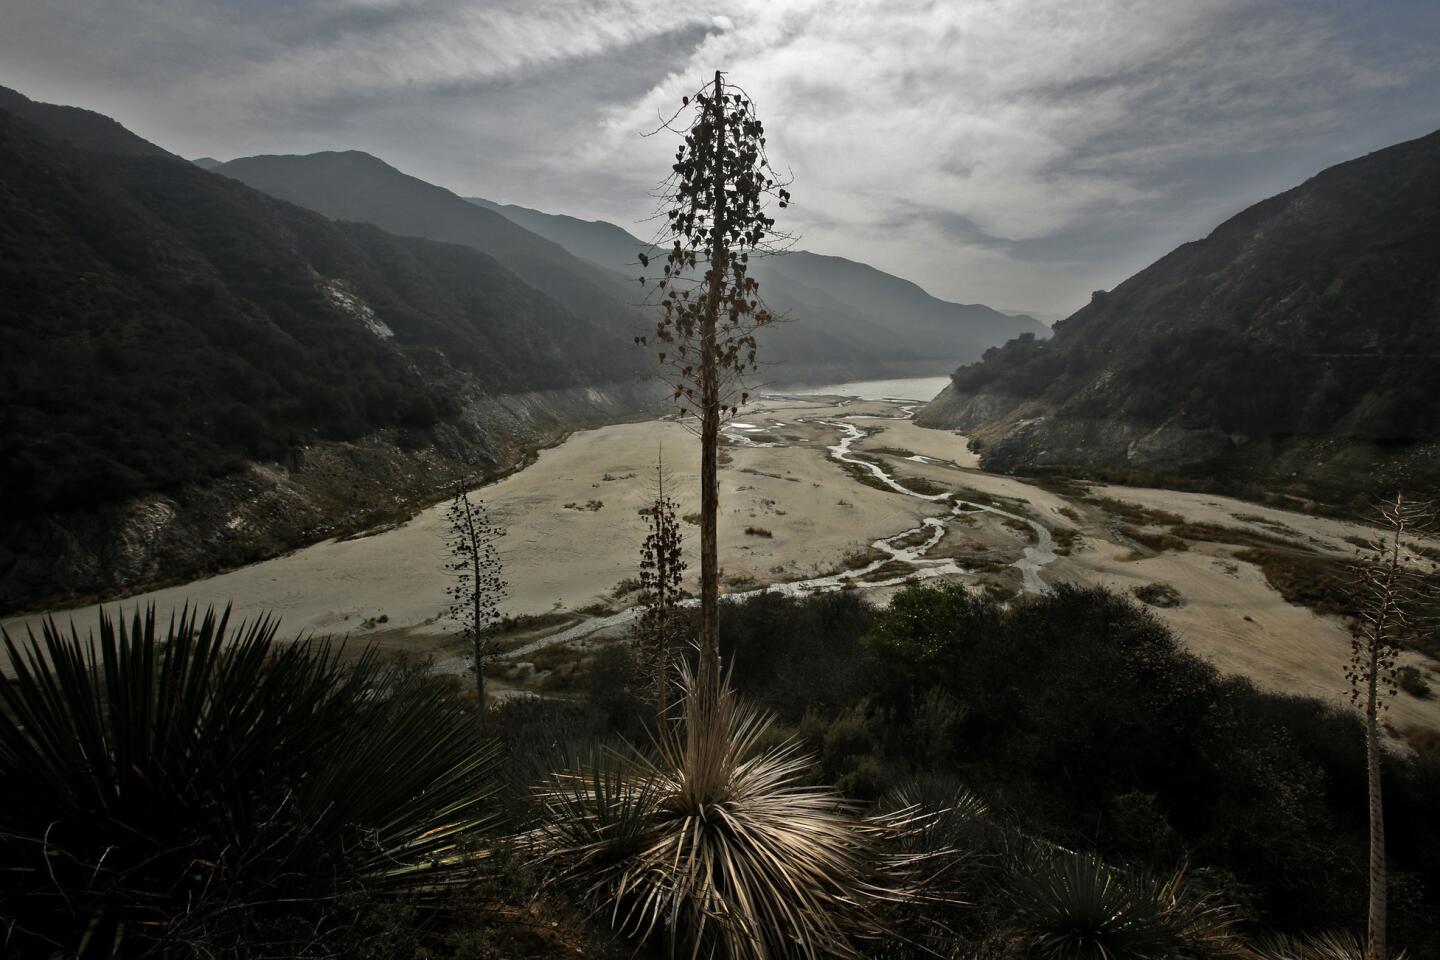
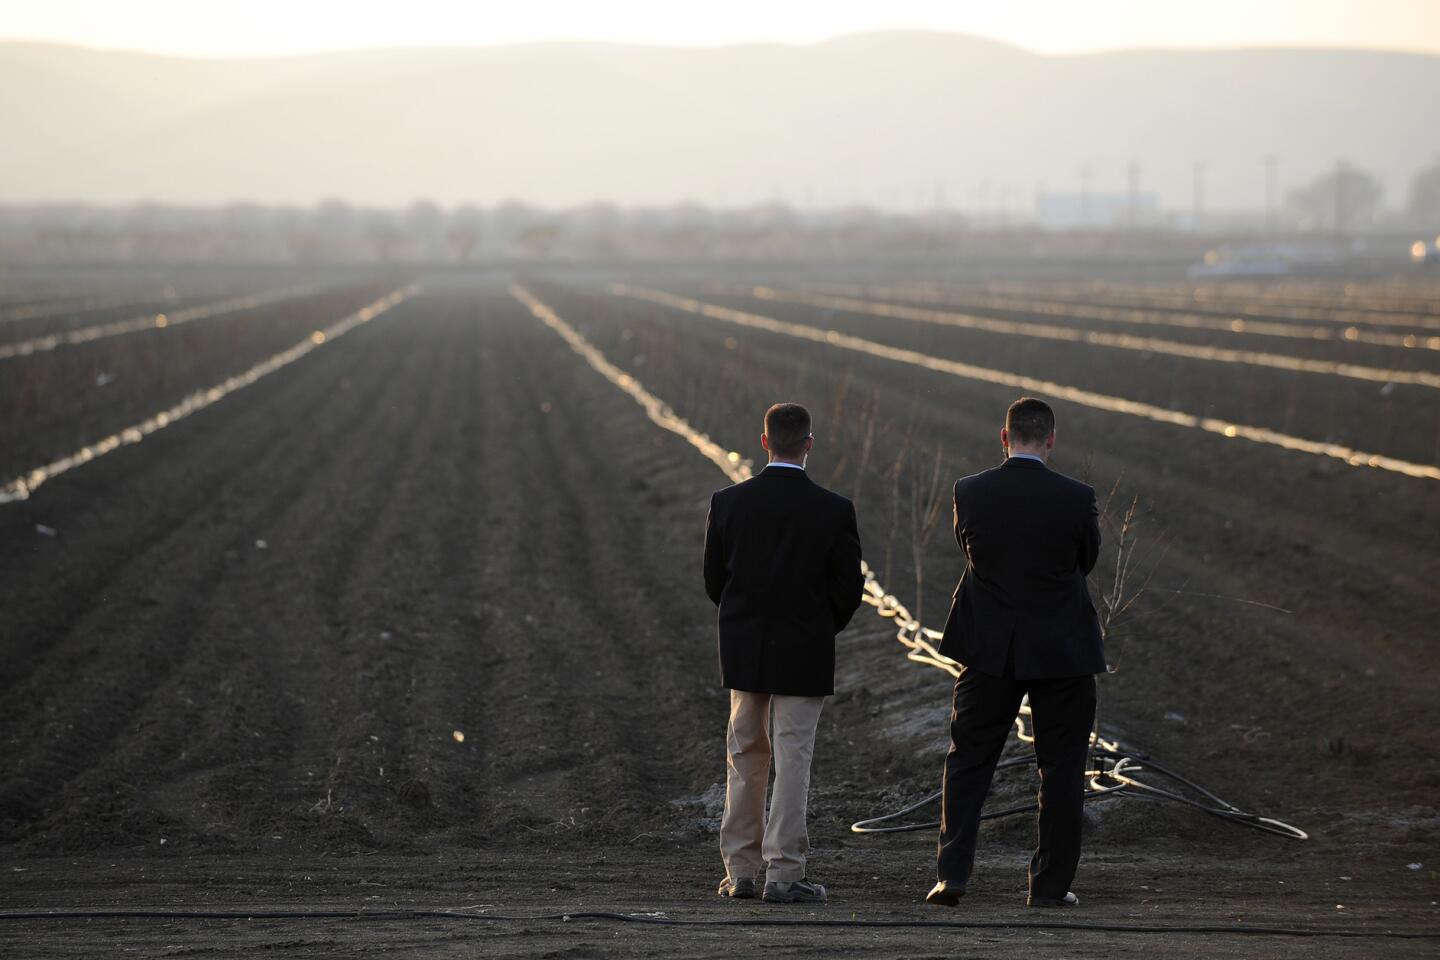
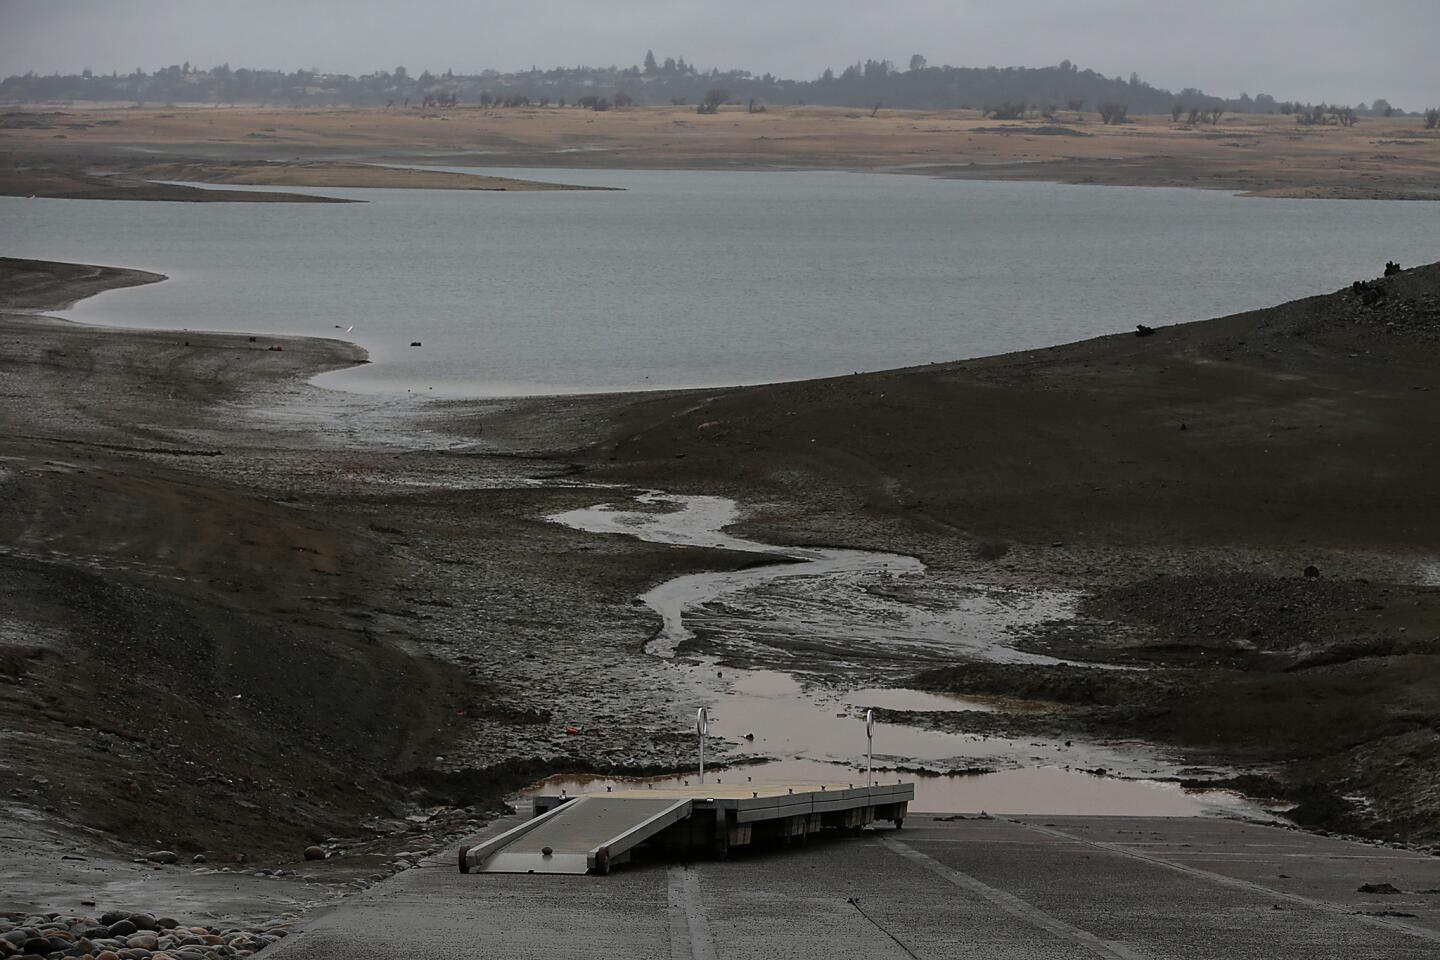
California is already experiencing adverse weather with firefighters across the state reporting bone-dry vegetation and mountains that can explode into fast-moving wildfires with a spark. And drought conditions are worsening in the Central Valley.
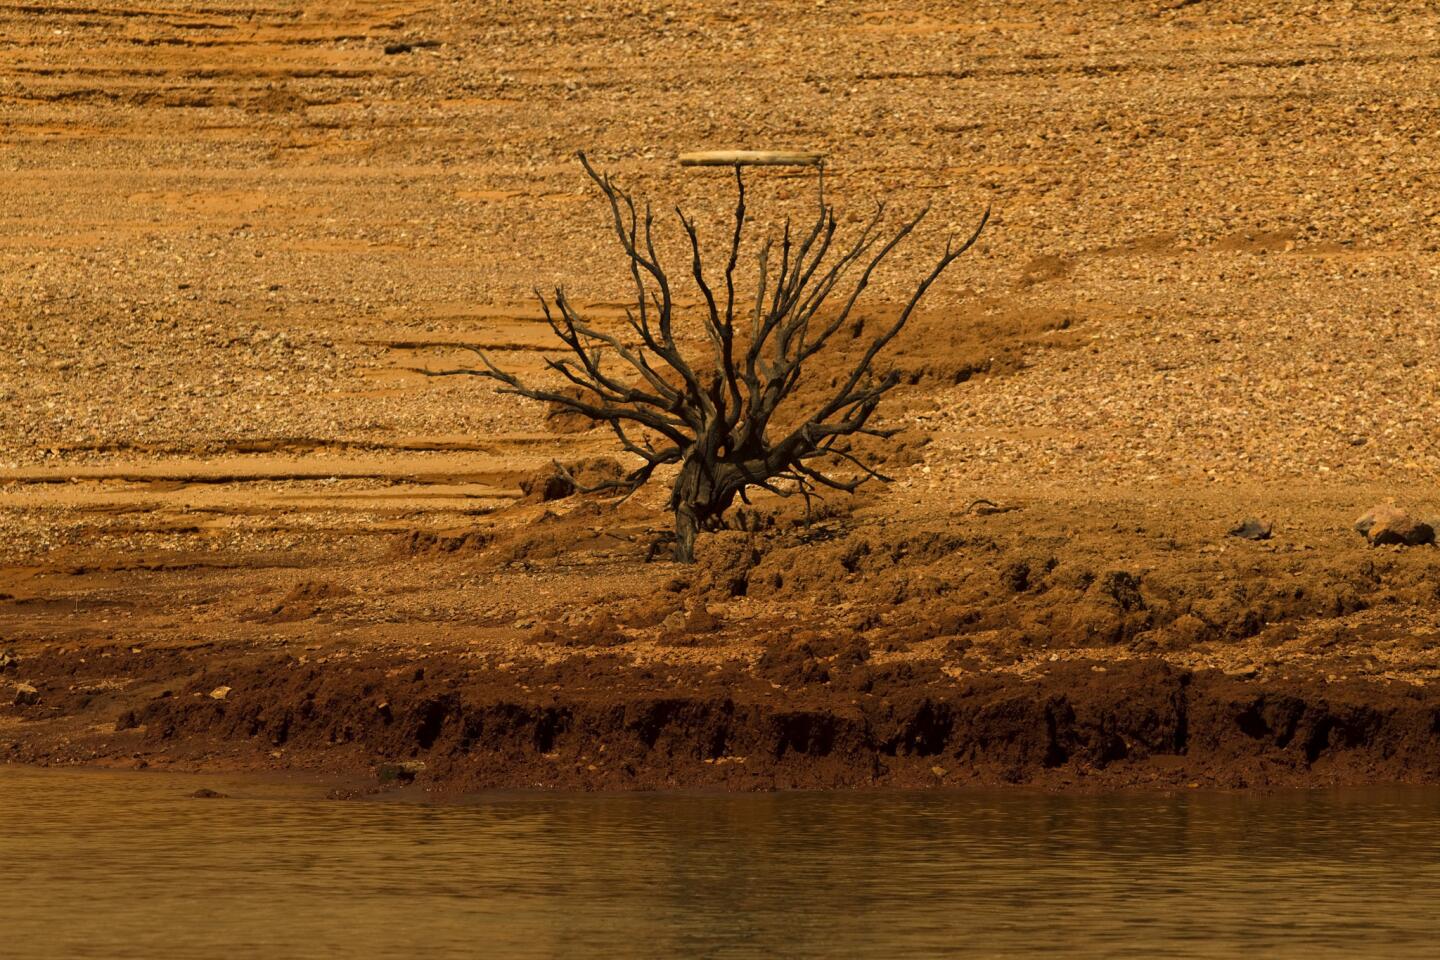
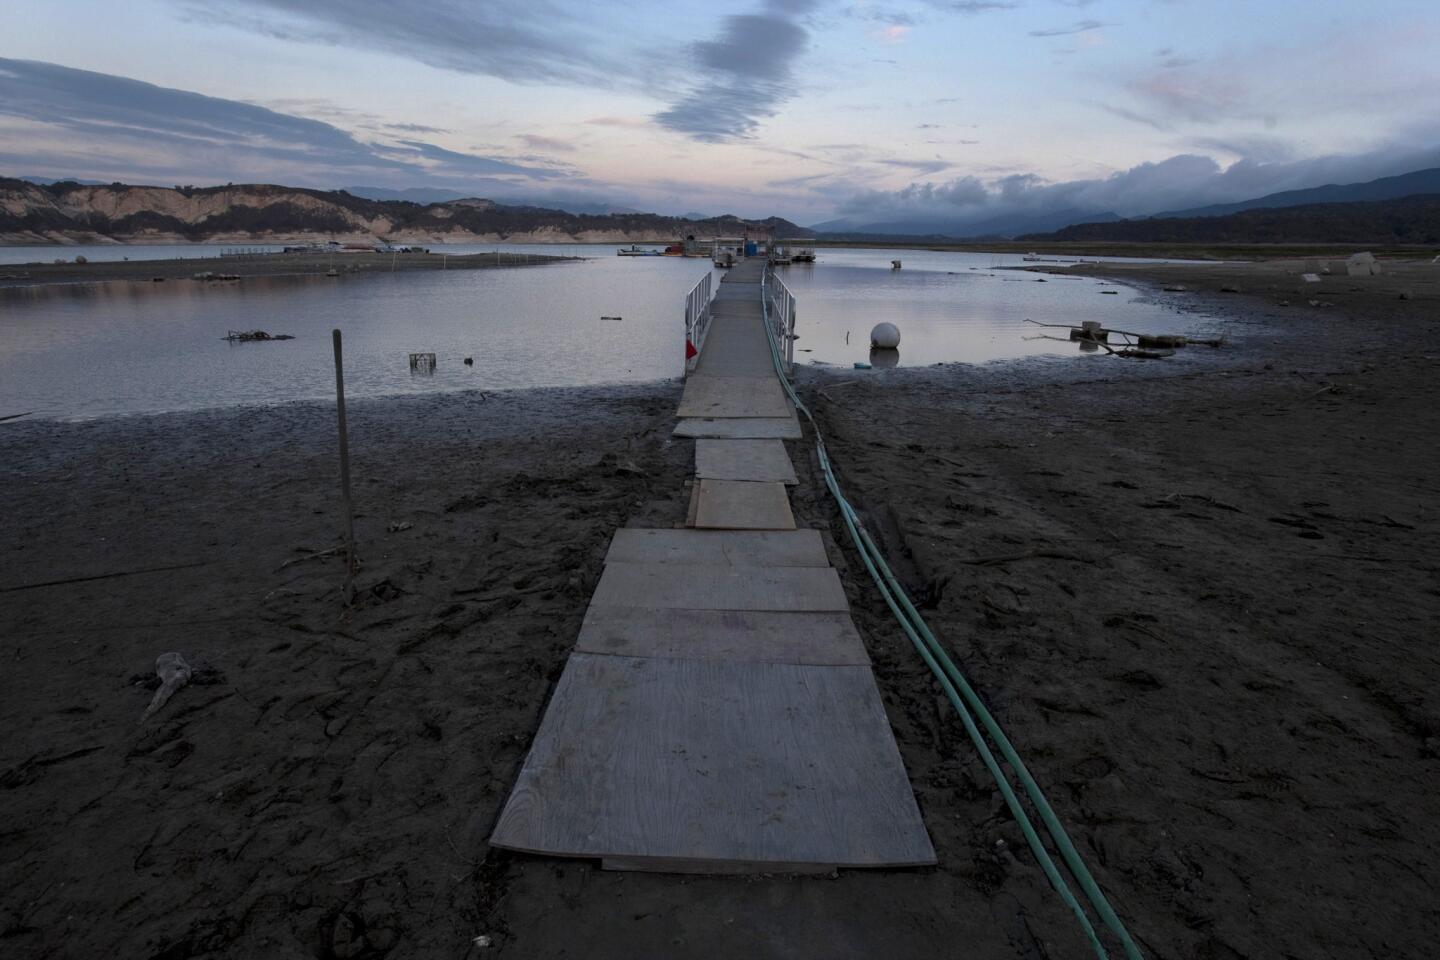
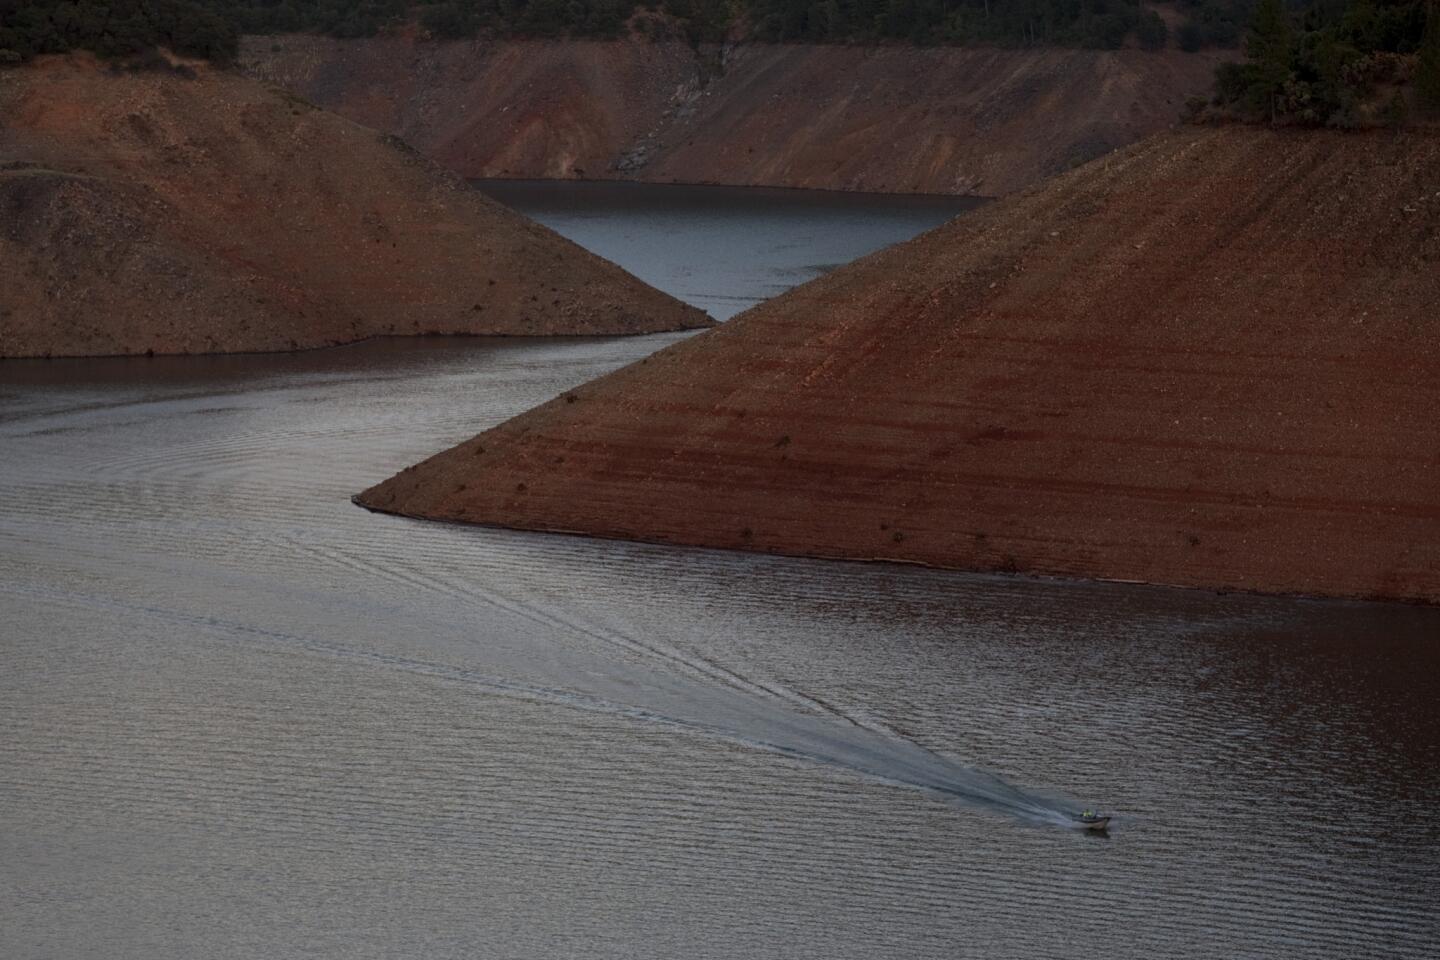
With more than 80% of the state in an extreme drought, dry conditions will probably continue and will not improve much in the next few months, said climatologist Brian Fuchs of the National Drought Mitigation Center at the University of Nebraska.
The prolonged statewide drought means it will be “harder to break the cycle,” much like some thirsty regions in Oklahoma and the entire state of Texas, which have been struggling with drought since 2010, he said.
A U.S. Drought Monitor map released last week showed 81% of California in the category of extreme drought or worse, up from 78%. Three months ago, it was 68%.
Drought conditions in parts of Riverside, San Bernardino and San Diego counties also have worsened.
The maps created by Fuchs and 10 other climatologists are based on 50 indicators, including weather patterns, soil conditions and water activity.
“The impacts really tell the story,” he said.
The mapping project came about in 1999, when drought crippled Washington, D.C., and policymakers wanted to know its effect on the region. They funded an experiment requiring scientists from the center and the NOAA to work on a weekly detailed map, Fuchs said.
Soon enough, the maps became a vital part of determining the severity of a drought in a certain region. Months later, the U.S. Drought Monitor, which is produced by the center, NOAA and the U.S. Department of Agriculture, was established.
The maps’ authors weigh drought conditions in the United States from the low point of abnormally dry (D1) to exceptional drought (D4), the highest intensity.
With a great portion of California already in extreme drought, Fuchs said some have asked if it is possible to break through the highest level, an event that occurs once every 50 years.
A drought beyond that would have to be an event that happens once every 200 to 300 years, he said.
“It would be a significant event,” Fuchs said.
Twitter: @JosephSerna
Twitter: @VeronicaRochaLA


Start your day right
Sign up for Essential California for news, features and recommendations from the L.A. Times and beyond in your inbox six days a week.
You may occasionally receive promotional content from the Los Angeles Times.